
Mobile User Research
Intel
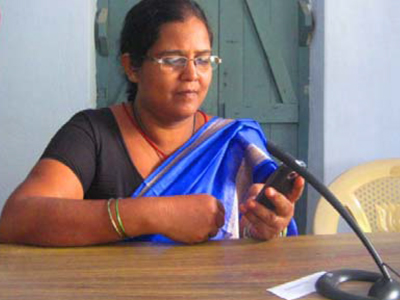
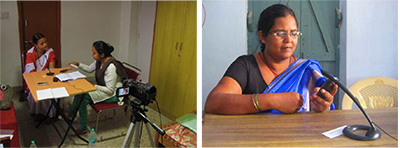
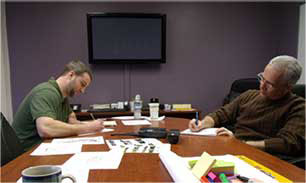
User Interview
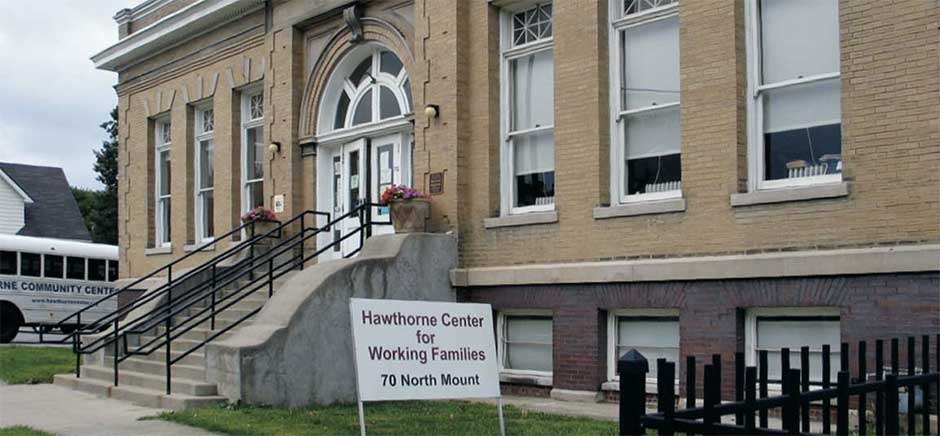
Location: Bangalore, India
Role: Project Manager and UX Researcher
Intel UXE group wanted to have a deeper understanding of the emerging trends in the mobile/tablets industry in India, in order to develop a platform appropriate for this market.
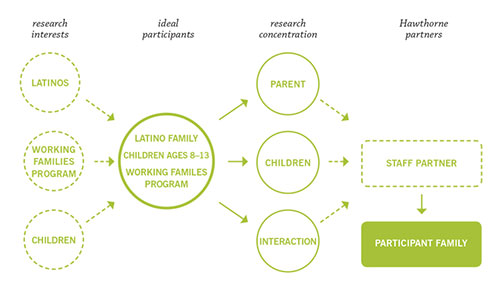
The goal of this project was to understand experience implications, successes and pain-points of technologies and solutions already deployed in the market by analyzing products, services, apps, marketing strategy and user's perspective. Targeted participants were men and women between the age of 18 to 35.
First, we collected exploratory data through informal conversations, immersion, literature, and expert interviews.
Contextual Grounding
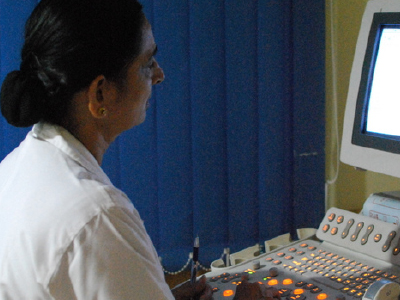
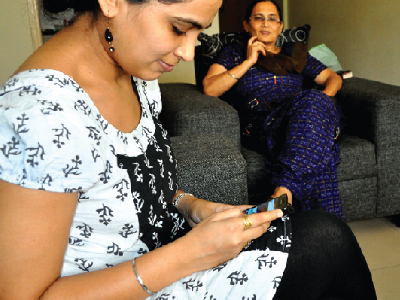
We spoke with college students and working professionals to understand their usage of smartphones and tablets. We discussed the factors and influence while making the purchase decision, their everyday use of devices, with family and friends. We also discussed their fulfilled and unfulfilled expectations with their service providers. Key findings were that the users were spending a mojority of their device time on social networking apps and playing games.
We visited retail outlets to gain an insight into the device-buying experience. The stores we visited were single branded, multi branded and small shops. Key findings were the trustworthiness and a better experience at the small shops rather than the 'alienating' larger stores.
Further Data Collection
We conducted expert interviews with high end users to gain insight into their extensive use of devices. We wanted to understand their ways of using multiple devices, at home and at work. We spent time with college students observing how they used their devices in the presence and absence of their friends and family.
Secondary Research
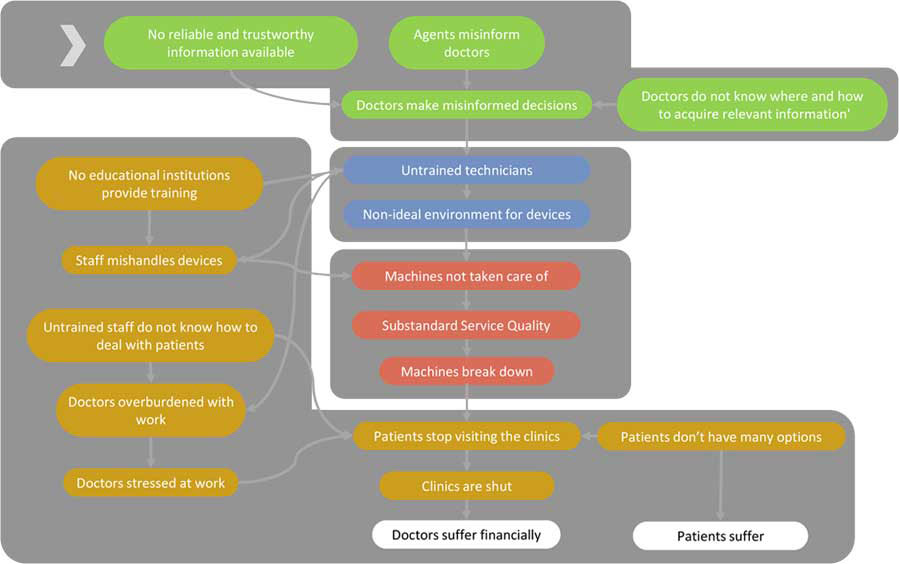
We began secondary data collection to do a competetive landscape analysis of mobile solutions that are already deployed in the market. We found out that due to the recent 3G scams and unreliable business models, the local handset manufacturers were forced to either shut down or merg into other established companies. Also, Value Added Services (which is popular as a telecommunications industry term for non-core services, or in short, all services beyond standard voice calls and fax transmissions), is turning into a primary source of revenue for mobile operators.
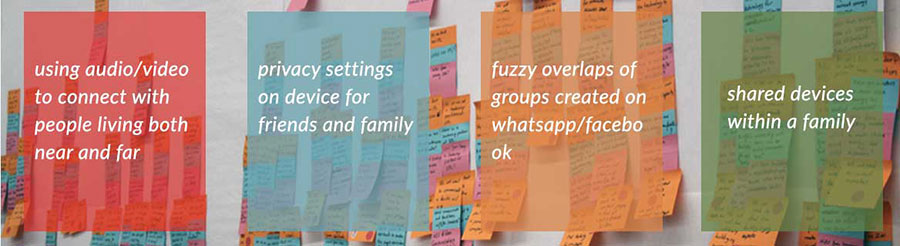
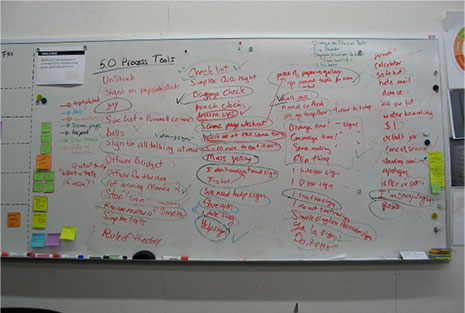
Four themes were synthesized from primary data collection and secondary sources.
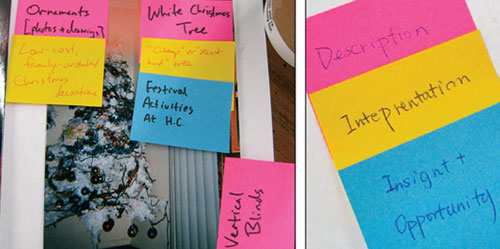
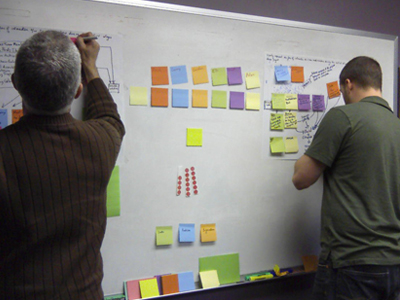
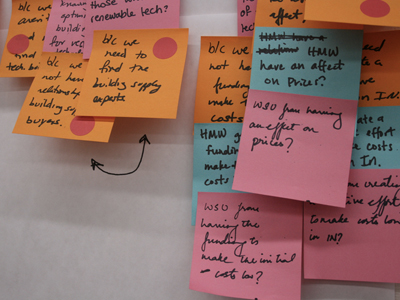
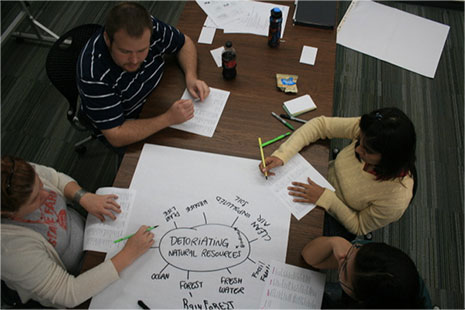
Analysis Process
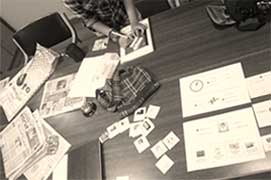
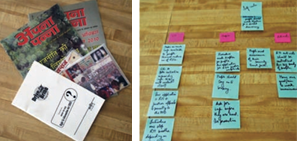
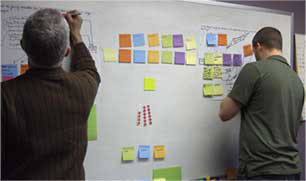
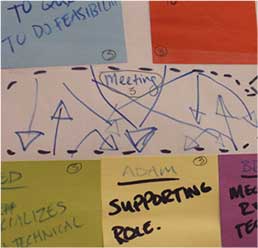
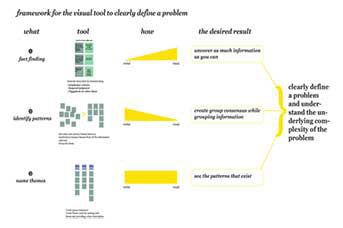
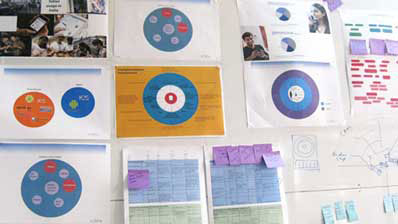
Analysis was ongoing throughout the process. We put up interesting quotes and stories of users, along with important secondary research on the walls. We created affinity diagrams grouping together key insights as they emerged. We abstracted themes out of these diagrams and made sure these connected clearly back to the people’s stories. We were able to derive 4 themes after a second round of abstraction.
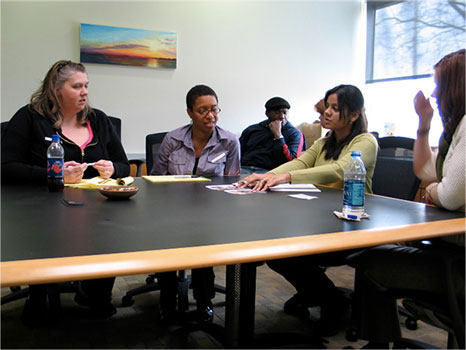
Identifying Opportunity Space
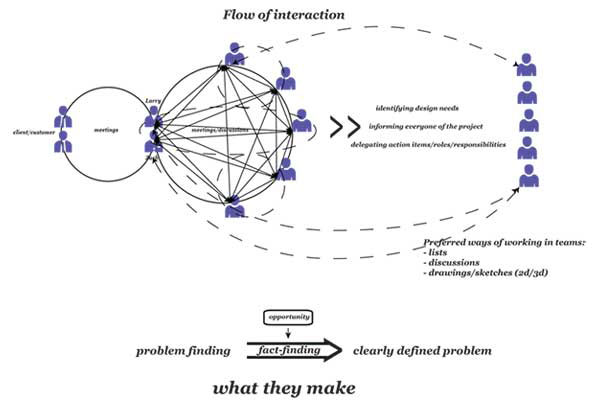
We held a brainstorming session, focusing on the 4 themes that emerged frmo the analysis process. We brought in people, who were unaware of the process, including other designers, researchers, expert users and general users. (These users were defined earlier in the process)
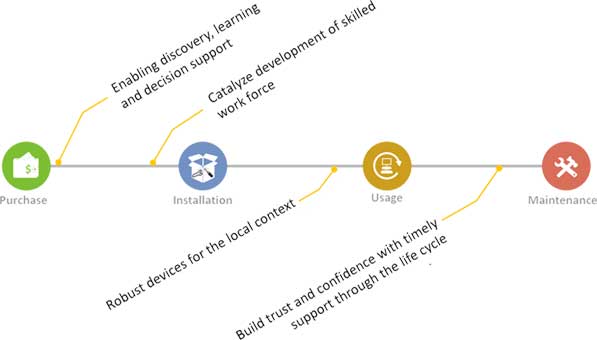
We diverged on each of the themes as a major function of a new mobile device. And then converged to an abstract level of the ideas generated for new device concepts. Our conclusion took into account people’s stories, behaviours, trends in the market.
Data Analysis